Locating Devices was always a interesting use case for me and I was happy to find this Blog Post which has also motivated me to dig deeper. The blog did already explain most of the things I needed to achieve my goal of locating lost or even stolen managed devices. Some of the questions I had in my mind were: What happens if I need to know where the Devices are located physically? When was the last contact to that device and the last GPS Coordinates it submitted? How can I share or visualize this data?
Now, when it comes to collecting data, there is always the aspect of privacy but we can use it on some devices just for testing purpose to evaluate risk and benefits.
Tools and Services I used:
- Powershell
- Azure Log Analytics
- Endpoint Manager -> Proactive Remediation
What I did is, take the script from the blog post above and add some additional features like sending the output to a Log Analytics Workspace and more.
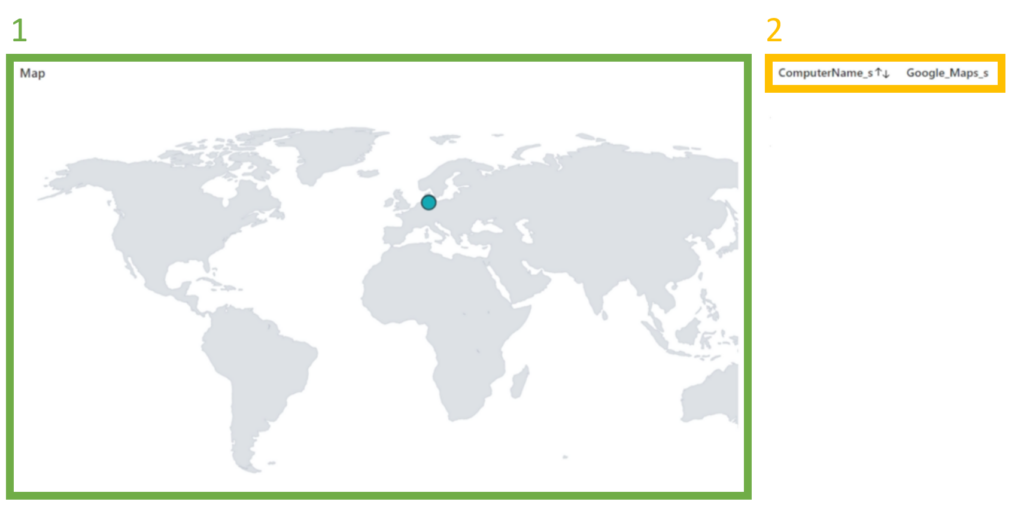
Before going deeper of how the script works, this is how it would look like in a Log Analytics Workbook.
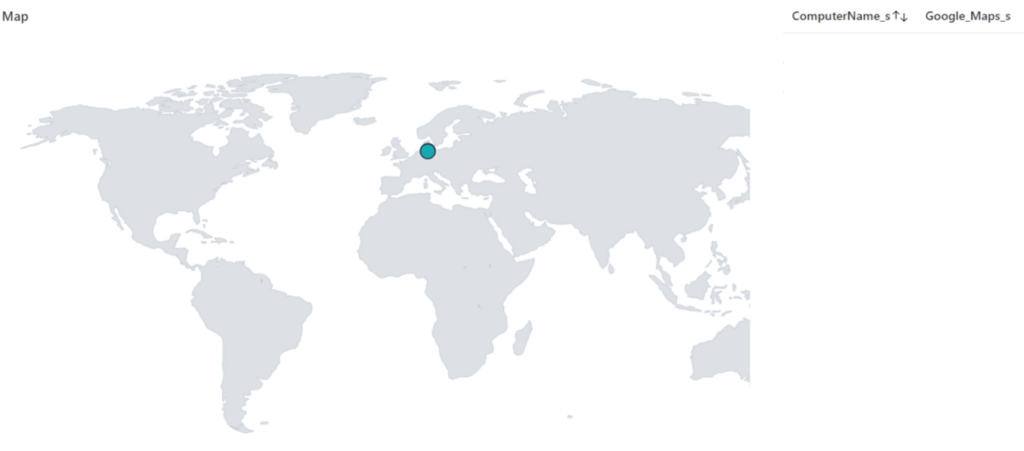
Its highly possible that you would see more green dots when you deploy the script on multiple devices from multiple countries.
As you can see there are two parts in this Illustration:
- World map: The location of the device is presented on the map.
- Table: Here you will see the Device name and the associated Google Maps link.
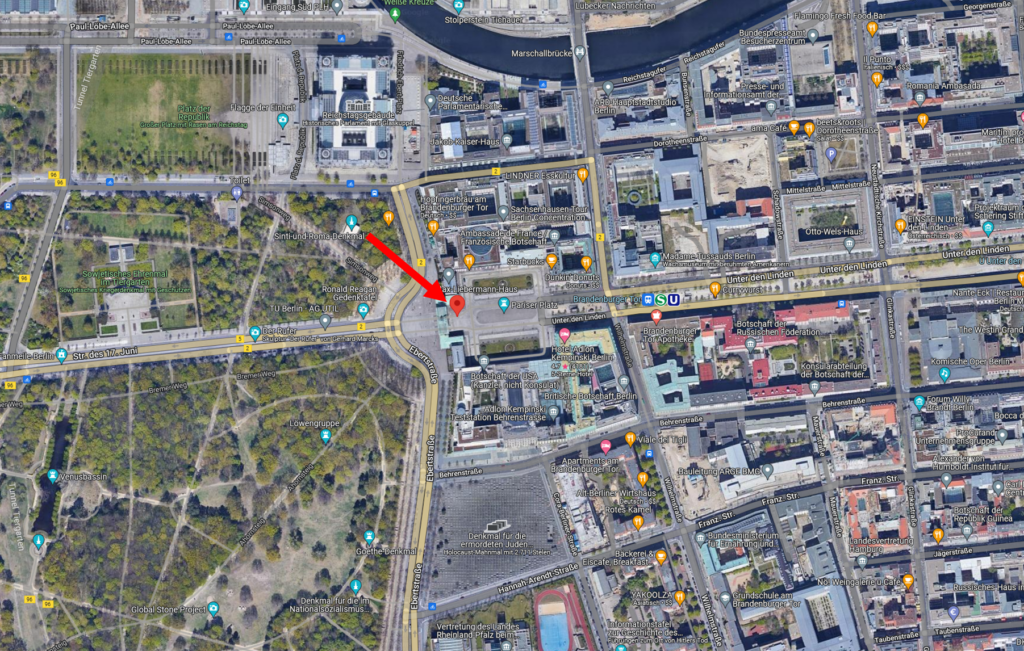
This is the example Google Maps Link:
https://www.google.com/maps?q=52.51635440097009,13.37798429510807
Note: The Google Maps link is essentially in the following format and we will use that logic in the script also:
“https://www.google.com/maps?q=” + “$Latitude” + “,” + “$Longtitude”
This is the location of the device which you can see in Google Maps. As you can see, I am in front of the Brandenburger Tor in Berlin 🙂
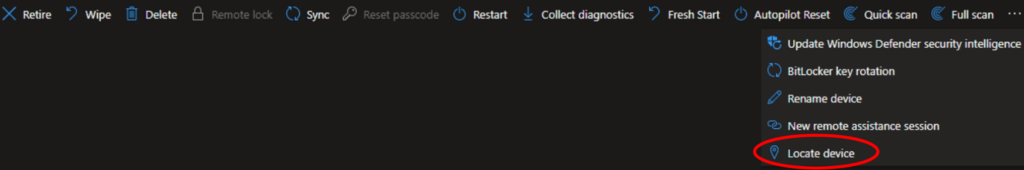
Before I start explaining the script -> You can also locate the device in the Endpoint Manager Portal.
But: I found it much more reliable to get the data with a script, which you could run every day or have any form of trigger. The best part is that you can send the data to Azure Log Analytics and create a Workbook, as seen above, to make it visually accessible for management or other interested parties.
In case you still want to go with the Endpoint Manager Portal way, you can find the settings here:
Home -> Devices -> Choose “Locate device”
Info: The feature "Locate Devices" is available for Windows, MacOS, iOS and Android.
After it is done gathering the data, Intune will show a Map with the approximately location of that specific device.
Disclaimer:
My device is on Windows 11 and I am testing this in my testing environment. Before you try out, what I describe in this article, make sure to carefully read and understand the implications. Always test and validate it in your environment. I don't take any responsibility for e.g. damages or failures.
First things first – Definitions
1. What is a Log Analytics Workspace?
“Log Analytics Workspace acts as a logical storage unit where you can easily store, retain, and query data collected from various resources that have been monitored in Azure to provide valuable insights for those resources.” Source
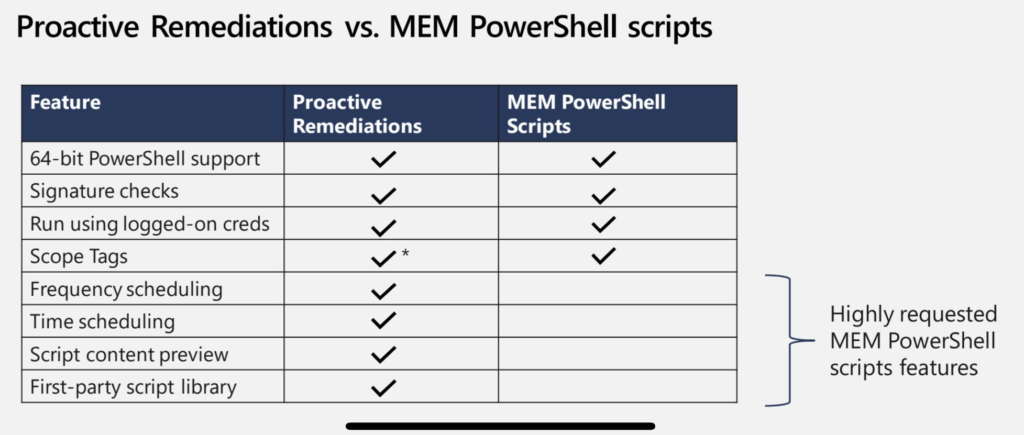
2. What is Proactive Remediation?
“Proactive remediation’s are a pair of scripts used to detect and remediate a problem on a machine. The first script runs a query on your endpoints that returns an exit code of success or failure. We call this first script the detection script. On a successful exit code it is reported as “Without issue” in the Intune portal and nothing else is executed. On a failed exit code the second script is run which is called a remediation script.” Source
From my experience using Proactive Remediation is kind of a second generation of Powershell Script deployments. As explained in this Post, the biggest advantage is that we can set a schedule when the script should run on that device after deployment. We can use this feature to let the script run e.g. every day and send the data to the above mentioned Log Analytics Workspace.
Prerequisites before we start:
1. Create a Log Analytics Workspace:
Guide: How to create a Log Analytics Workspace.
2. Create a Azure App with the following API Permission: DeviceManagementManagedDevices.Read.All
Try and test if you need other permissions but the above mentioned should be enough for this use case.
Guide: How to create a Azure App registration.
This is the script I am using:
The Output of that script will include two data points:
- Latitude
- Longtitude
Collecting the data is easy. Deploy the script on a device and let it run. But where do we store that Output?
The Powershell Script is uploading the output to the Log Analytics Workspace.
Just fill in the following parameters to test it in your environment:
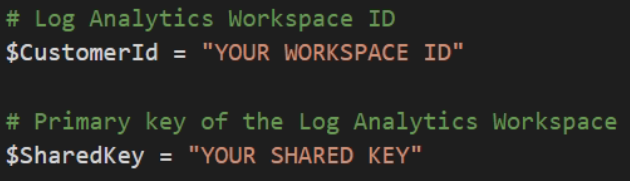
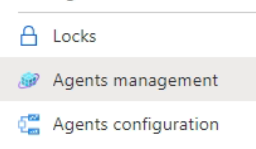
You can find your Customer ID (= Workspace ID) and Shared Key (= Primary Key) in your Log Analytics Workspace -> Agents management option:
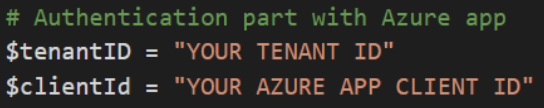
You can find your Tenant ID in the Azure Active Directory and the Client ID in your App registration.
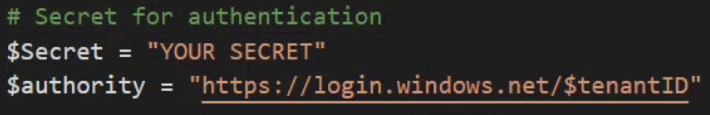
You can create a Secret in your Azure App Registration from above.
Lets look into that script even more:
Step by Step of what the Script does:
- Connect to MS Graph and authenticate via a App Registration.
- Enable Localization Service on the device.
- Collect Longtitude and Latitude.
- Disable Localization Service on the device.
Connecting to MS Graph and authenticating with a App Registration:
Update-MSGraphEnvironment -AppId $clientId -Quiet
Update-MSGraphEnvironment -AuthUrl $authority -Quiet
Connect-MSGraph -ClientSecret $Secret -Quiet
Enable the Localization Service:
$Path = "SOFTWARE\Microsoft\Windows\CurrentVersion\CapabilityAccessManager\ConsentStore\location" |
Disable the Localization Service:
$Path = "SOFTWARE\Microsoft\Windows\CurrentVersion\CapabilityAccessManager\ConsentStore\location" |
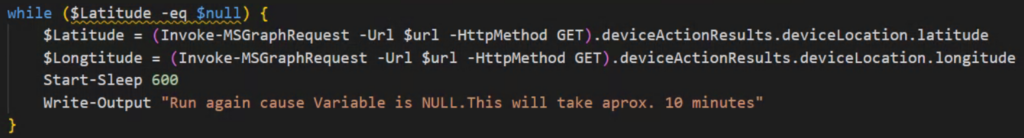
Collecting Longtitude and Latitude:
There is one challenge we have to be aware of. The duration of the process of requesting the location of the device via Graph API and really getting the data so that we can upload it to Log Analytics does not take a fixed number of minutes. Based on my tests it takes between 10 Minutes to 4 hours. Because of this variability we wait in the Script for any response with the while() command. You can set the delay insight the while() loop to your liking. I was happy with it looking for any output every 10 minutes.
Deployment:
I am using proactive Remediation to deploy the script on my Intune managed device.
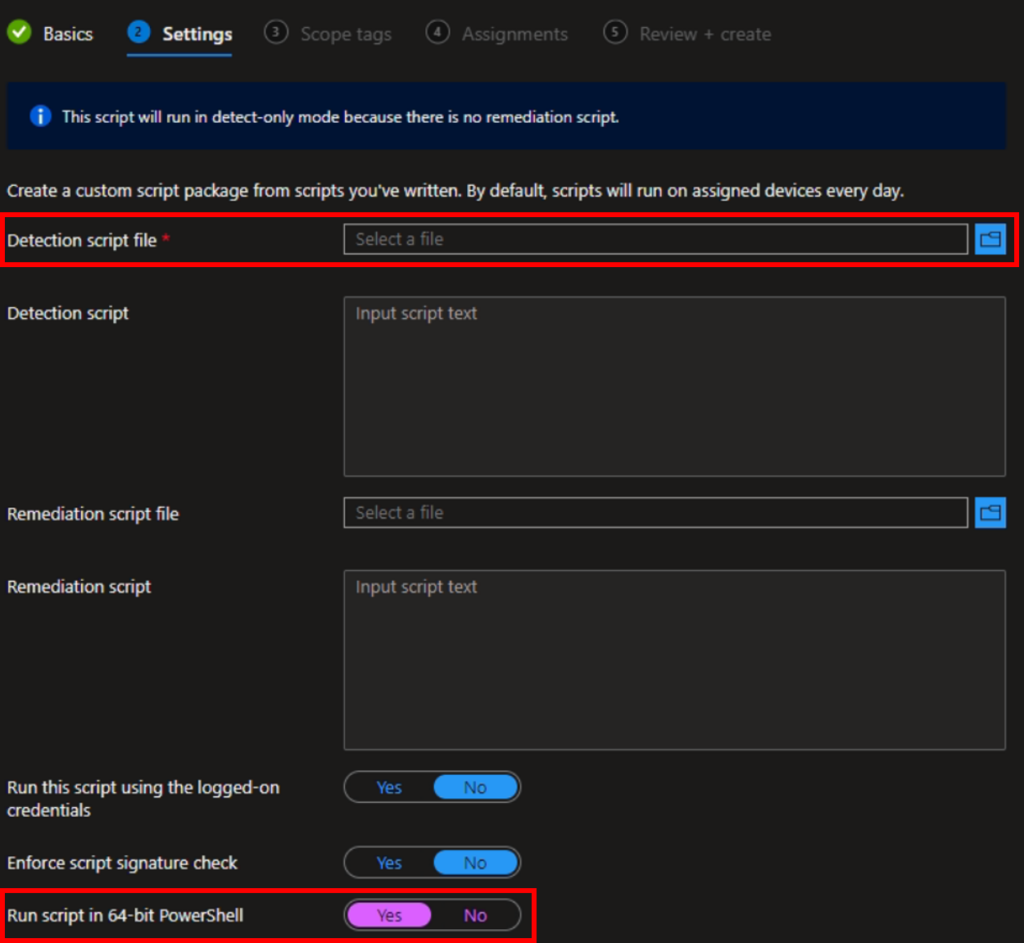
Go to the Endpoint Manager Portal -> Reports -> Endpoint Analytics -> Proactive remediations -> Click on “Create script package”
In the Settings Blade you can upload the script here:
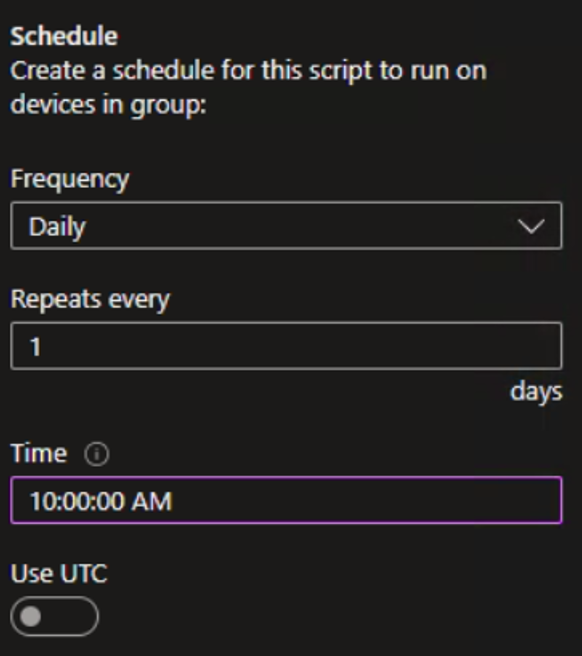
At the Assignments blade you can choose a Device Group to deploy the script and also configure the schedule. This is a example and you should choose the best options which would make the most sense in your case:
After the Deployment:
The Powershell Script will run, depending on the configured schedule, and upload the latitude as well as longtitude data to the Log Analytics Workspace. You can find the data here: Azure Portal -> Log Analytics Workspace.
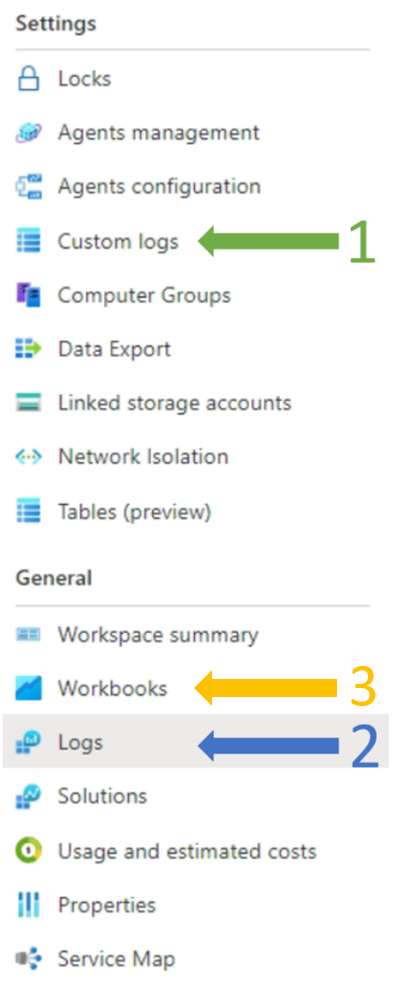
In the following Screenshot you can see three specific points that are important:
- Custom Logs: Here you can see the Data that the Powershell Script did upload.
- Logs: Query the Date in the Custom Log.
- Workbook: Visualize the Data.
Here is an example KQL query which you can run under “Logs”:
Localization_CL
| project ComputerName_s, Google_Maps_s
Azure Workbook – Visualize the Data
You can also create a Workbook to build a Dashboard and visualize the Data from the logs you previously collected. Following are the two KQL Queries which you can use to create the Dashboard I showed you at the beginning of this blog.
1. Worldmap
Set the Visualization to Map and Size to Full.

Localization_CL
| summarize arg_max(TimeGenerated,*) by ComputerName_s
| project ComputerName_s, Longtitude_s, Latitude_s
2. Table
Set the Visualization to Grid and Size to Full.

Localization_CL
| summarize arg_max(TimeGenerated,*) by ComputerName_s
| project ComputerName_s, Google_Maps_s
Closing Words
I hope that this post was helpful and provided you with an Idea how to utilize Powershell and Log Analytics to collect and visualize Data. Take what you learned here and think about other problems you could tackle with the knowledge you gained. Maybe collect event logs from the clients and visualize Errors?
1 thought on “Locate your managed Devices with Powershell and Log Analytics”
Comments are closed.