Introduction
I am using this email Report for a long time and I read on Twitter that others are using something similar. So why not share my flow and the queries?
How does it work?
You will be able to automate this process by creating a Power Automate Flow that will query the Intune Data from a Log Analytics Workspace and then visualize the output as a HTML Table. The resulting tables will be included in the body of a email that will be sent out daily. The tables will only include data from the last 24 hours.
What is inside the mail?
The daily Intune Monitoring Reporting email will include the following data:
- Total number of devices in Intune.
- Number of devices that were active and have reported to Intune in the last 24 hours.
- Configuration changes in the last 24 hours.
- Successful Device Enrollments in the last 24 hours.
- Failed Device Enrollments in the last 24 hours.
- Deleted Devices from Intune in the last 24 hours.
Prerequisites
- Access to Power Automate and a license (Some of following steps are only available for Premium Licenses or use a 30 day trial license)
- Log Analytics Workspace with Logs from Intune -> Guide
Powerautomate – Create Flow
This is how big the Flow will be at the end. (I know it has a bad resolution):
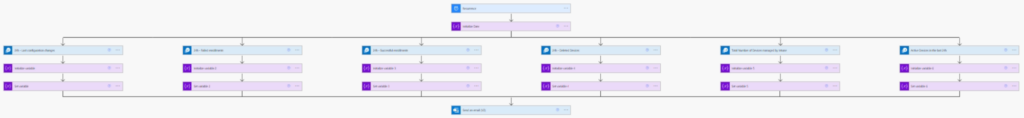
Let´s dive into every step. You can follow by creating your own flow at the same time and copy paste the content as follows:
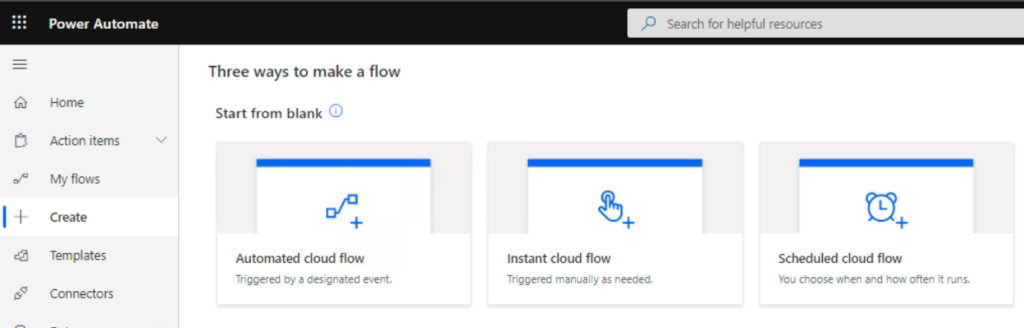
Create Flow
Go to Power Automate, select + Create and then select Scheduled cloud flow:
Fill out the fields and click Create:
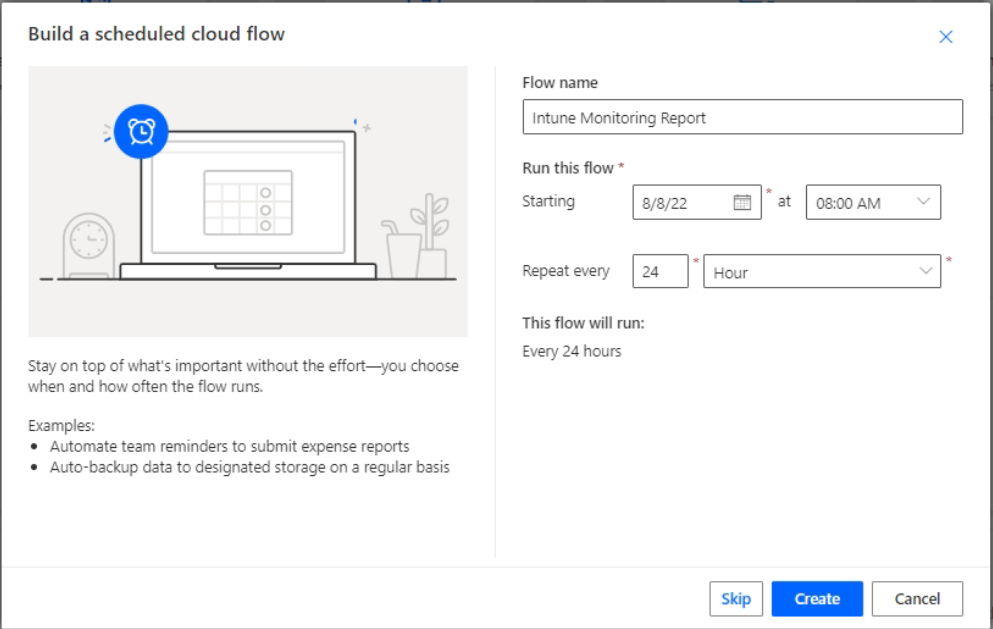
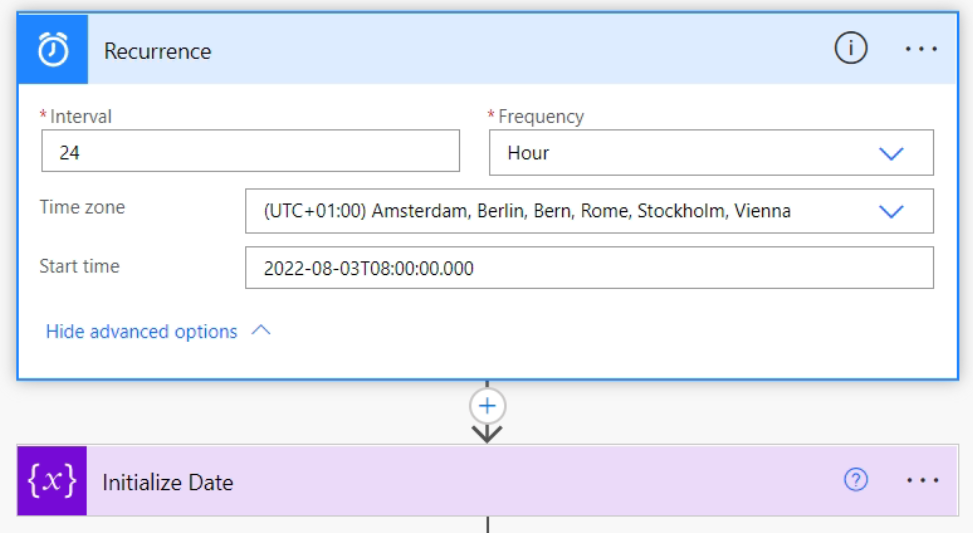
Recurrence
I have set the Interval to 24 hours and the Start time to 8 AM. That means that I will get an email every 24 hours at 8 AM. We will also set the time range to 24 hours in each of the following queries so that the data in the mail will always represent the last 24 hours. You can change the data if you need.
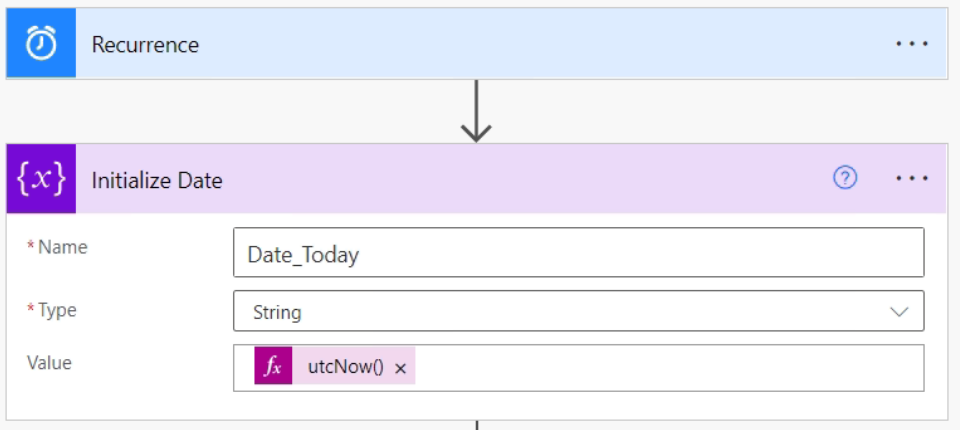
Initialize Date
This is not required but I think it´s nice to have the date of when this report was created in the subject of the mail so I can find the mail later in my inbox.
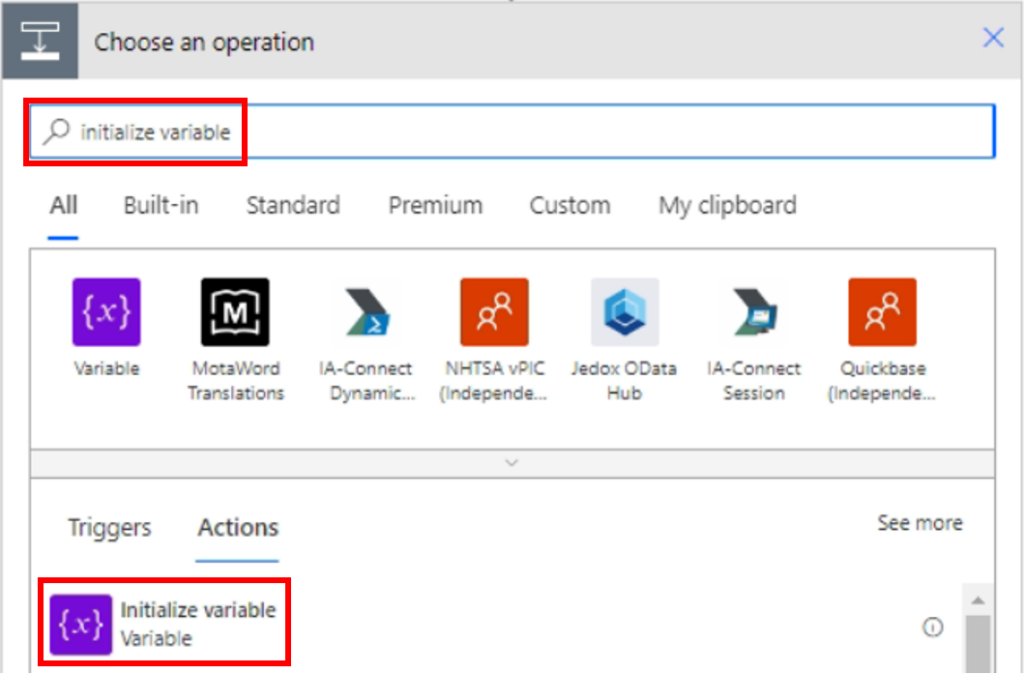
Click on + New Step and search for Initialize Variable:
This is how it should look like:
Queries
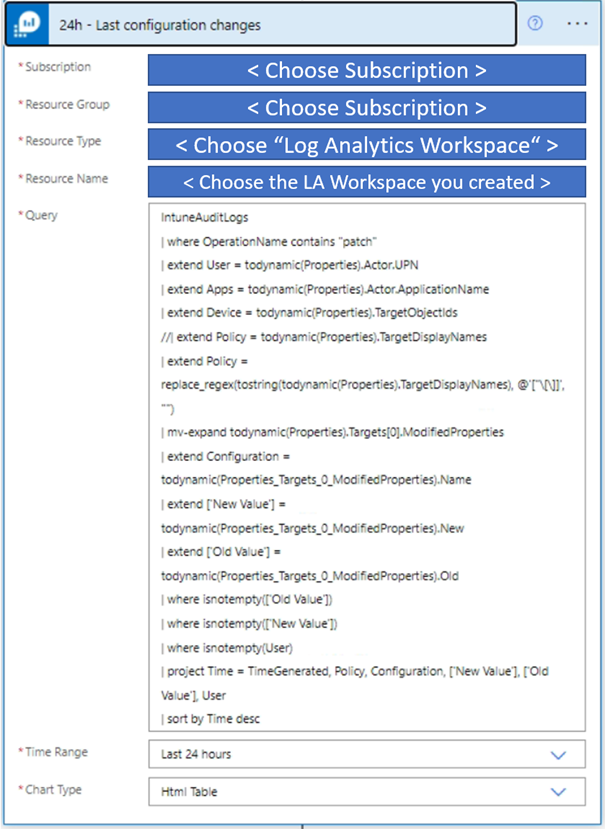
In the following steps, you will have to choose the following Data which is unique for your environment.
- < Choose Subscription > = The subscription in which you have your log analytics Workspace.
- < Choose Resource Group > = The resource group inside your subscription in which you have your log analytics workspace.
- < Choose “Log Analytics Workspace“ > = Choose Log Analytics Workspace from the drop-down menu.
- < Choose the LA Workspace you created > = Choose the LA Workspace in which the Intune logs are gathered. This Workspace is inside the Resource Group and Subscription you have picked on the steps before.
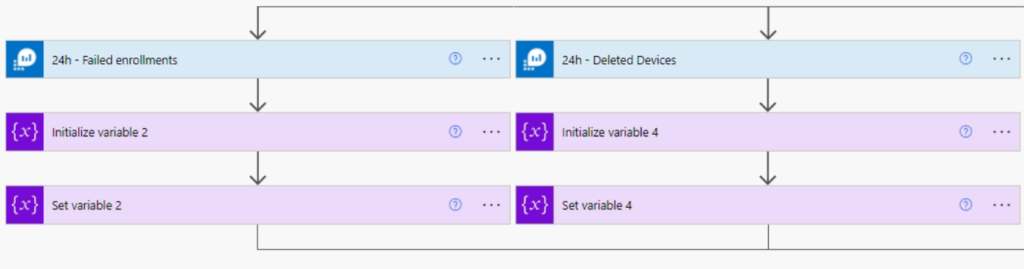
Before we start a quick note: The following steps are all parallel to each other and not step after step.
Example for two of the total six steps or actions:
24h – Last configuration changes
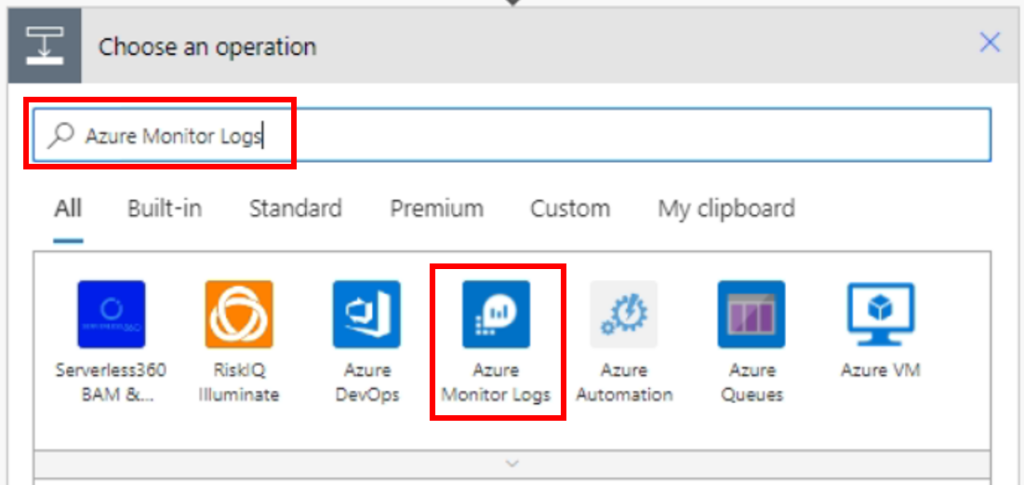
Add a new step, search “Azure Monitor Logs” and select it from the results:
Copy and paste the query:
IntuneAuditLogs
| where OperationName contains "patch"
| extend User = todynamic(Properties).Actor.UPN
| extend Apps = todynamic(Properties).Actor.ApplicationName
| extend Device = todynamic(Properties).TargetObjectIds
| extend Policy = replace_regex(tostring(todynamic(Properties).TargetDisplayNames), @'["[]]', "")
| mv-expand todynamic(Properties).Targets[0].ModifiedProperties
| extend Configuration = todynamic(Properties_Targets_0_ModifiedProperties).Name
| extend ['New Value'] = todynamic(Properties_Targets_0_ModifiedProperties).New
| extend ['Old Value'] = todynamic(Properties_Targets_0_ModifiedProperties).Old
| where isnotempty(['Old Value'])
| where isnotempty(['New Value'])
| where isnotempty(User)
| project Time = TimeGenerated, Policy, Configuration, ['New Value'], ['Old Value'], User
| sort by Time desc
This is how it should look like. Pay attention to define the time range and also the Chart Type as HTML Table.
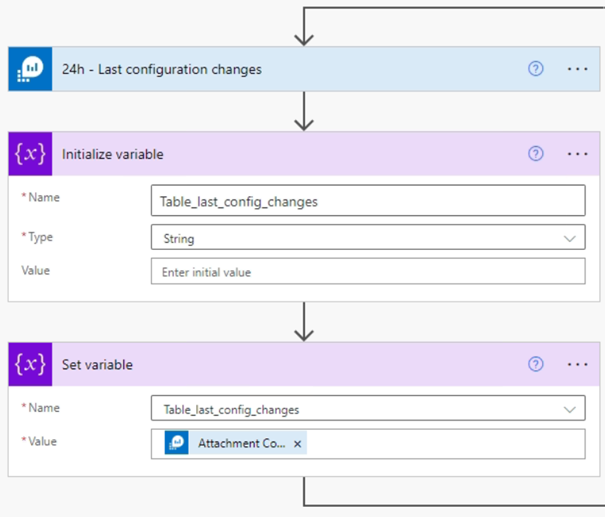
Now we have to set a variable with the output of the KQL Query. It should look like the following screenshot and don’t forget to select the Attachment Content in the bottom box. We will need the name of the Variable (Table…) later to create the email.
Click on the + Button at the top and create a new action by clicking on Add an action:
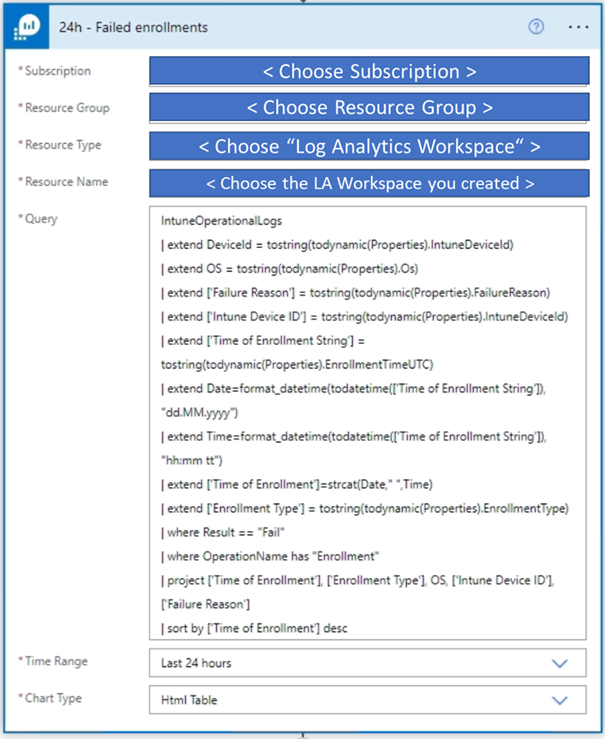
24h – Failed enrollments
Add a new step, search “Azure Monitor Logs” and select it from the results:
Copy and paste the query:
IntuneOperationalLogs
| extend DeviceId = tostring(todynamic(Properties).IntuneDeviceId)
| extend OS = tostring(todynamic(Properties).Os)
| extend ['Failure Reason'] = tostring(todynamic(Properties).FailureReason)
| extend ['Intune Device ID'] = tostring(todynamic(Properties).IntuneDeviceId)
| extend ['Time of Enrollment String'] = tostring(todynamic(Properties).EnrollmentTimeUTC)
| extend Date=format_datetime(todatetime(['Time of Enrollment String']), "dd.MM.yyyy")
| extend Time=format_datetime(todatetime(['Time of Enrollment String']), "hh:mm tt")
| extend ['Time of Enrollment']=strcat(Date," ",Time)
| extend ['Enrollment Type'] = tostring(todynamic(Properties).EnrollmentType)
| where Result == "Fail"
| where OperationName has "Enrollment"
| project ['Time of Enrollment'], ['Enrollment Type'], OS, ['Intune Device ID'], ['Failure Reason']
| sort by ['Time of Enrollment'] desc
This is how it should look like. Pay attention to define the time range and also the Chart Type as HTML Table.
Now we have to set a variable with the output of the KQL Query. It should look like the following screenshot and don’t forget to select the Attachment Content in the bottom box. We will need the name of the Variable (Table…) later to create the email.
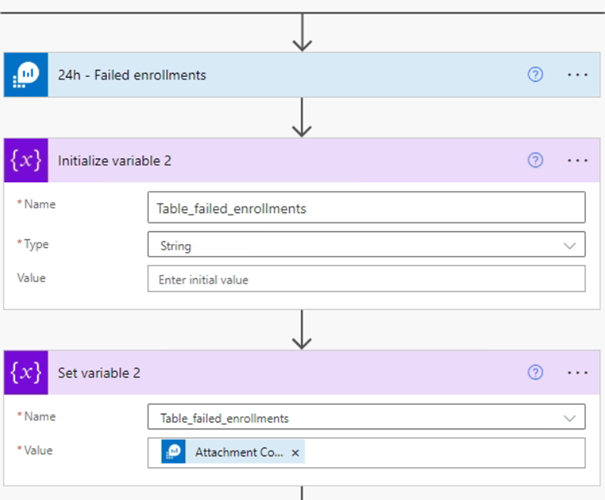
Click on the + Button at the top and create a new action by clicking on Add an action:
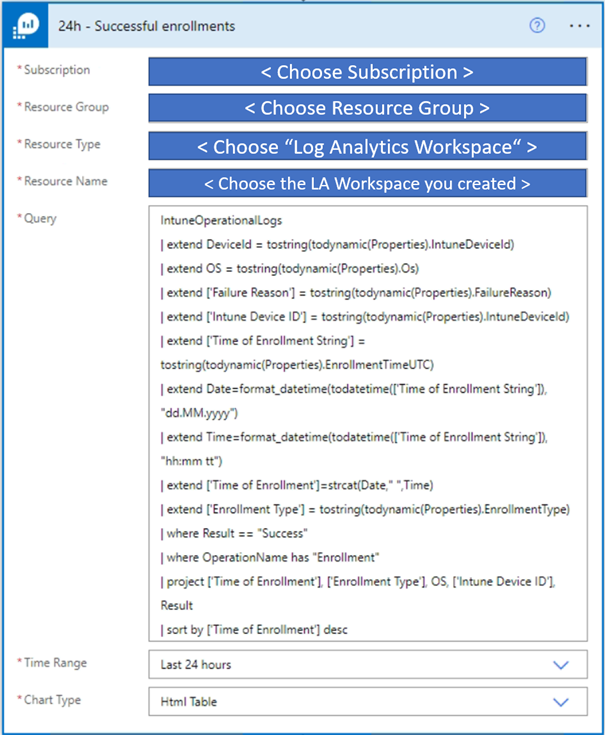
24h – Successful enrollments
Add a new step, search “Azure Monitor Logs” and select it from the results:
Copy and paste the query:
IntuneOperationalLogs
| extend DeviceId = tostring(todynamic(Properties).IntuneDeviceId)
| extend OS = tostring(todynamic(Properties).Os)
| extend ['Failure Reason'] = tostring(todynamic(Properties).FailureReason)
| extend ['Intune Device ID'] = tostring(todynamic(Properties).IntuneDeviceId)
| extend ['Time of Enrollment String'] = tostring(todynamic(Properties).EnrollmentTimeUTC)
| extend Date=format_datetime(todatetime(['Time of Enrollment String']), "dd.MM.yyyy")
| extend Time=format_datetime(todatetime(['Time of Enrollment String']), "hh:mm tt")
| extend ['Time of Enrollment']=strcat(Date," ",Time)
| extend ['Enrollment Type'] = tostring(todynamic(Properties).EnrollmentType)
| where Result == "Success"
| where OperationName has "Enrollment"
| project ['Time of Enrollment'], ['Enrollment Type'], OS, ['Intune Device ID'], Result
| sort by ['Time of Enrollment'] desc
This is how it should look like. Pay attention to define the time range and also the Chart Type as HTML Table.
Now we have to set a variable with the output of the KQL Query. It should look like the following screenshot and don’t forget to select the Attachment Content in the bottom box. We will need the name of the Variable (Table…) later to create the email.
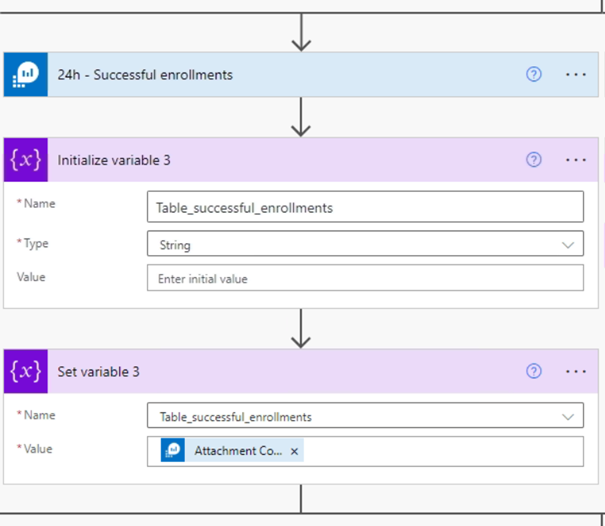
Click on the + Button at the top and create a new action by clicking on Add an action:
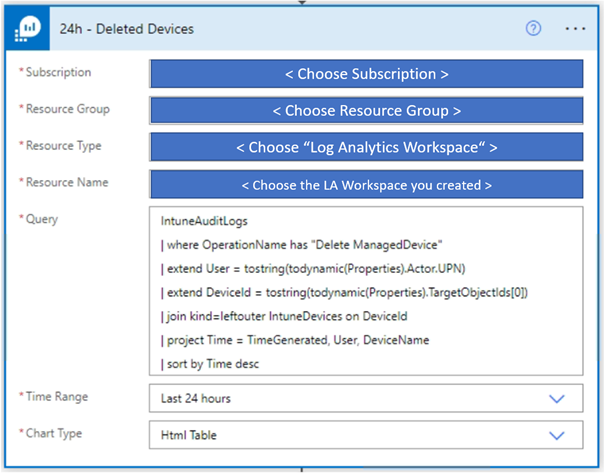
24h – Deleted Devices
Add a new step, search “Azure Monitor Logs” and select it from the results:
Copy and paste the query:
IntuneAuditLogs
| where OperationName has "Delete ManagedDevice"
| extend User = tostring(todynamic(Properties).Actor.UPN)
| extend DeviceId = tostring(todynamic(Properties).TargetObjectIds[0])
| join kind=leftouter IntuneDevices on DeviceId
| project Time = TimeGenerated, User, DeviceName
| sort by Time desc
This is how it should look like. Pay attention to define the time range and also the Chart Type as HTML Table.
Now we have to set a variable with the output of the KQL Query. It should look like the following screenshot and don’t forget to select the Attachment Content in the bottom box. We will need the name of the Variable (Table…) later to create the email.
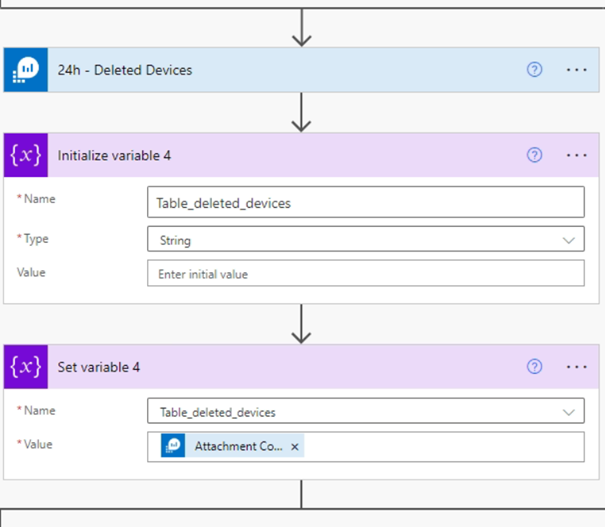
Click on the + Button at the top and create a new action by clicking on Add an action:
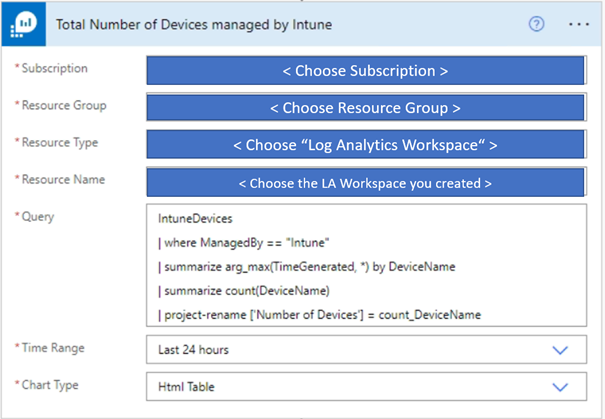
Total Number of Devices managed by Intune
Add a new step, search “Azure Monitor Logs” and select it from the results:
Copy and paste the query:
IntuneDevices
| where ManagedBy == "Intune"
| summarize arg_max(TimeGenerated, *) by DeviceName
| summarize count(DeviceName)
| project-rename ['Number of Devices'] = count_DeviceName
This is how it should look like. Pay attention to define the time range and also the Chart Type as HTML Table.
Now we have to set a variable with the output of the KQL Query. It should look like the following screenshot and don’t forget to select the Attachment Content in the bottom box. We will need the name of the Variable (Table…) later to create the email.
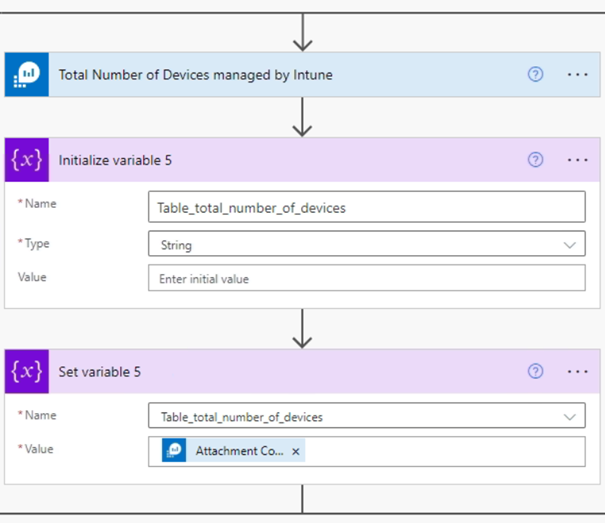
Click on the + Button at the top and create a new action by clicking on Add an action:
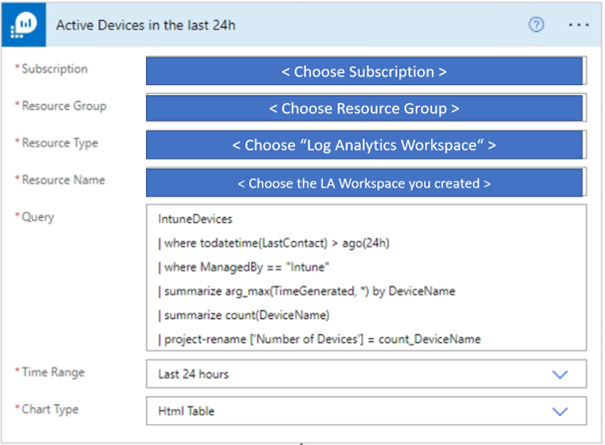
Active Devices in the last 24h
Add a new step, search “Azure Monitor Logs” and select it from the results:
Copy and paste the query:
IntuneDevices
| where todatetime(LastContact) > ago(24h)
| where ManagedBy == "Intune"
| summarize arg_max(TimeGenerated, *) by DeviceName
| summarize count(DeviceName)
| project-rename ['Number of Devices'] = count_DeviceName
This is how it should look like. Pay attention to define the time range and also the Chart Type as HTML Table.
Now we have to set a variable with the output of the KQL Query. It should look like the following screenshot and don’t forget to select the Attachment Content in the bottom box. We will need the name of the Variable (Table…) later to create the email.
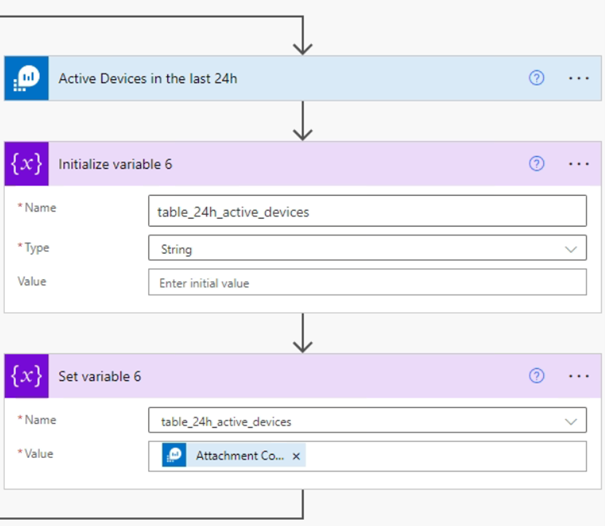
Click on the + Button at the top and create a new action by clicking on Add an action:
Send an email
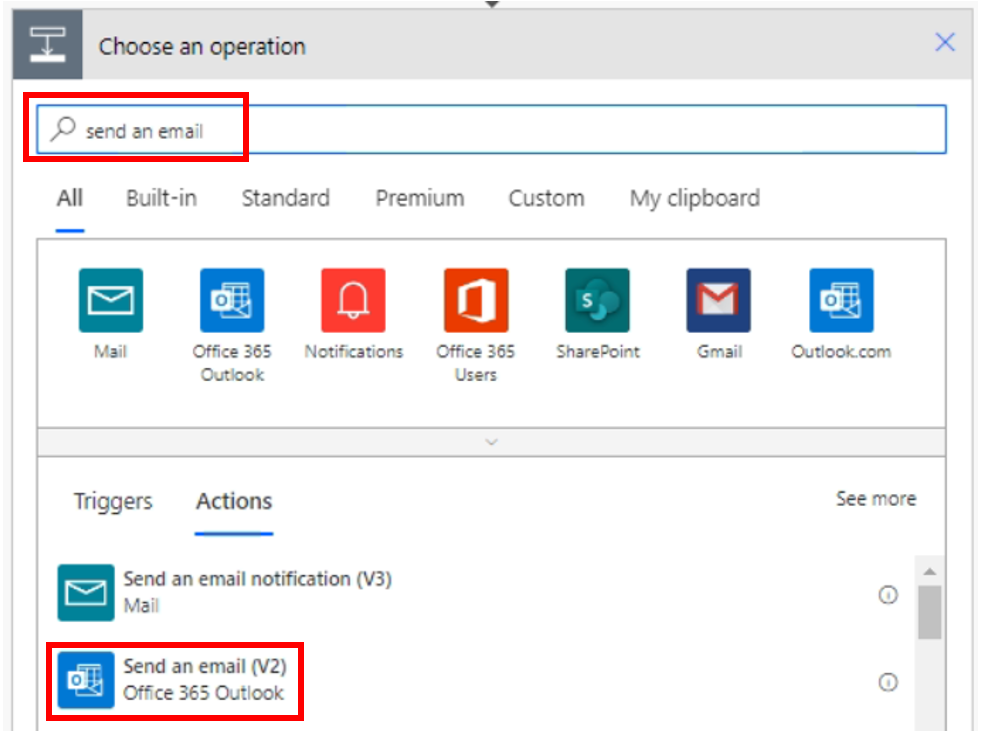
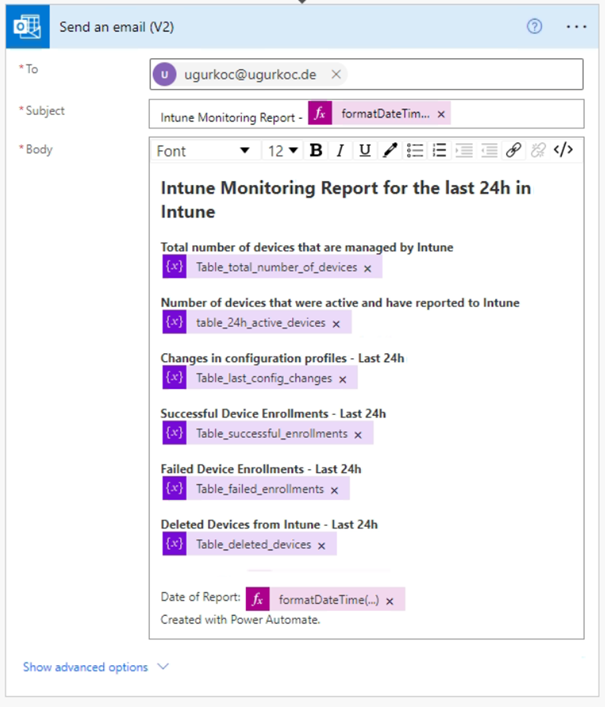
Type in your email address and add a Expression into the Subject field. Paste the following:
formatDateTime(variables('Date_Today'), 'MM/dd/yyyy')Just paste the following into the body or change it as you like it:
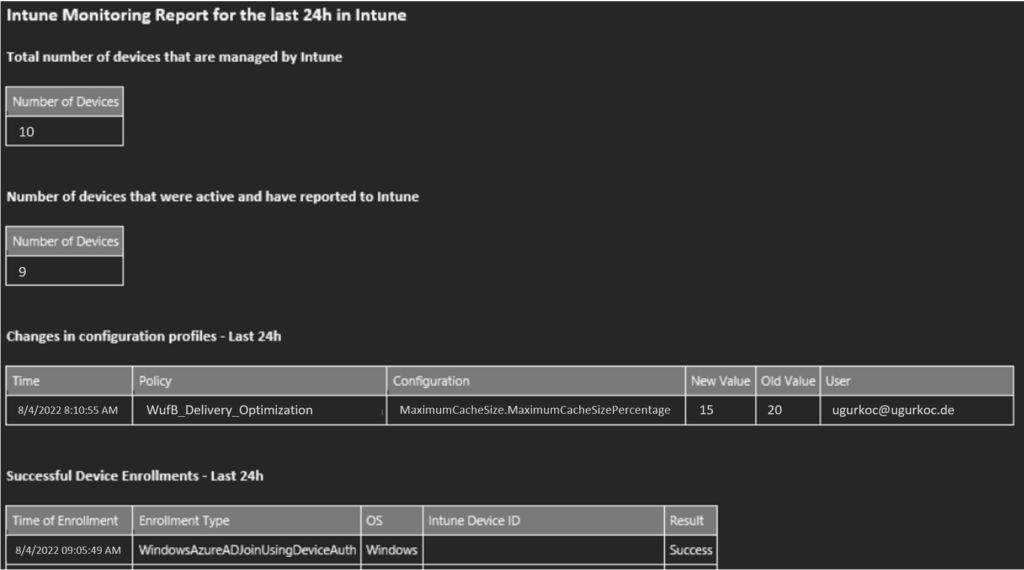
Intune Monitoring Report for the last 24h in Intune

Total number of devices that are managed by Intune
@{variables('Table_total_number_of_devices')}
Number of devices that were active and have reported to Intune
@{variables('table_24h_active_devices')}
Changes in configuration profiles - Last 24h
@{variables('Table_last_config_changes')}
Successful Device Enrollments - Last 24h
@{variables('Table_successful_enrollments')}
Failed Device Enrollments - Last 24h
@{variables('Table_failed_enrollments')}
Deleted Devices from Intune - Last 24h
@{variables('Table_deleted_devices')}

Date of Report: @{formatDateTime(variables('Date_Today'), 'MM/dd/yyyy')}
Created with Power Automate.
This is how it should look like:
Conclusion
I hope that this blog post was easy to follow. Feel free to message me on Linkedin or Twitter to ask questions or just leave a comment below.
1 thought on “Daily Intune Monitoring Report”
Comments are closed.